Total cryptocurrency market capitalization
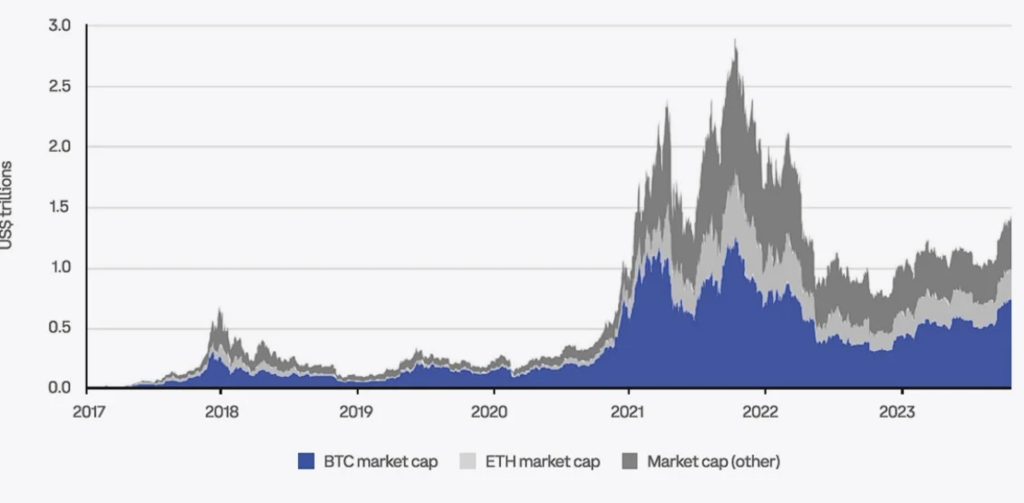
Total cryptocurrency market capitalization doubled in 2023. Growth was influenced not so much by technological innovations as by the crisis in regional US banks and intensifying geopolitical conflicts. BTC acts as an alternative safe haven for capital. Also, applications for exchange-traded funds (ETFs) for BTC are an implicit recognition of the cryptocurrency's potential to disrupt the established order.
Moving Global Money Supply M2 (MoM) vs. BTC

BTC performance (m/m) has surpassed M2 performance since October 2023.
Number of transactions in Ethereum
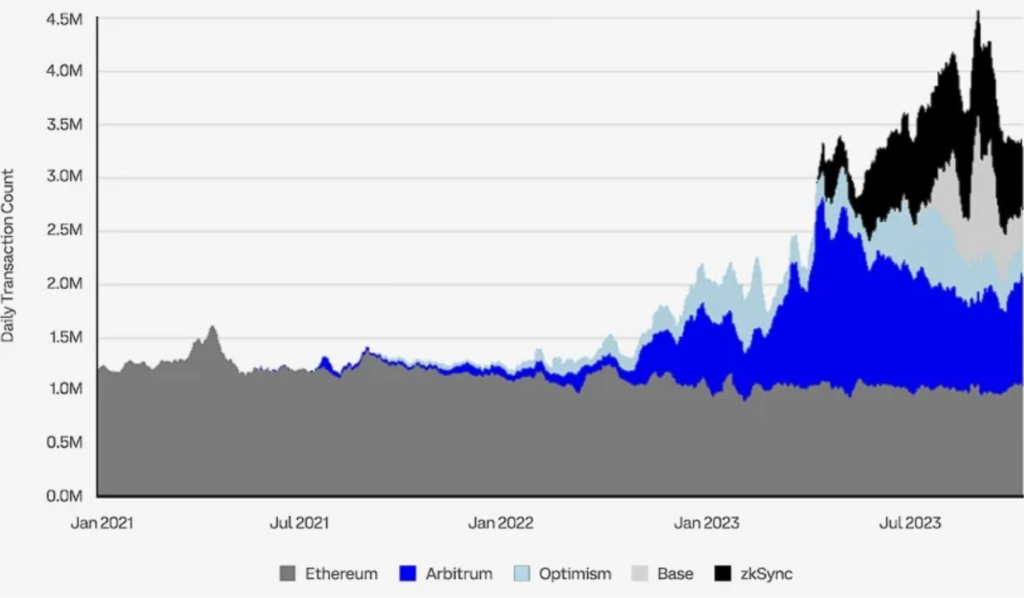
The rapid growth of L2 scaling solutions has been accelerated by the emergence of new rollup stacks such as OP Stack, Polygon CDK and Arbitrum Orbit. Despite the increase in the use of rollups, the number of transactions on Ethereum remained stable and averaged about 1 million per day. Compared to this, the aggregate activity on Arbitrum, Base, Optimism< /a> and zkSync currently totals over 2 million transactions per day.
Weekly active players on Ethereum
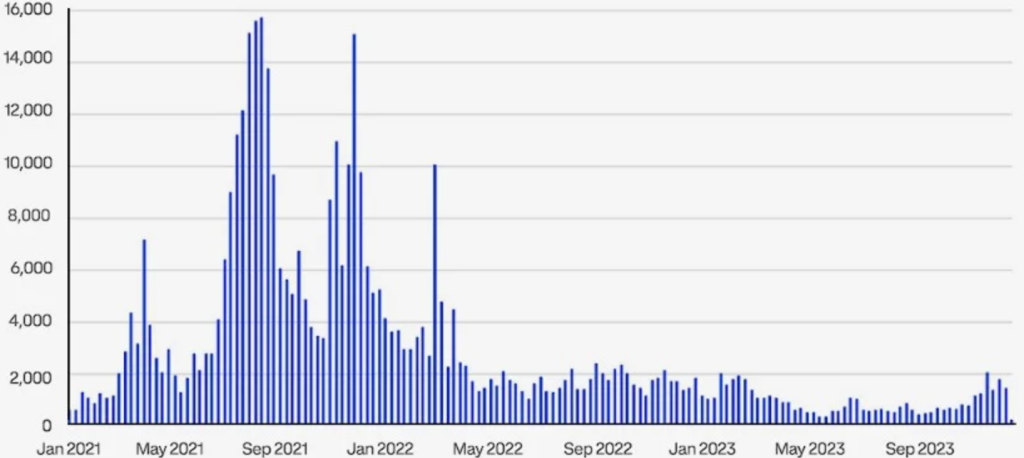
The number of weekly active players on ETH is returning to levels at the beginning of the year, after falling since spring 2023.
BTC profitability per terahash of mining power
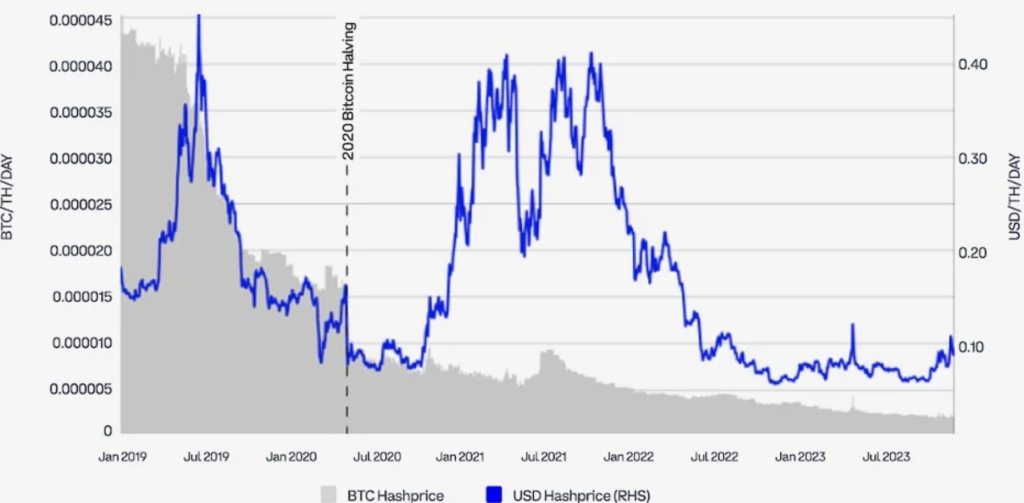 < p>Halving will impact supply dynamics among BTC miners and will act as an indicator of the viability of maintaining the network using a proof-of-work mechanism while significantly reducing block rewards. Competition among miners will increase and consolidation will occur to reduce costs.
 After reducing the block reward in 2020, the Hashprice Index decreased from $0.15 to $0.07. A similar decline is likely to be repeated in 2024, pushing the Hashprice Index below $0.04.
Breakdown of BTC miner rewards
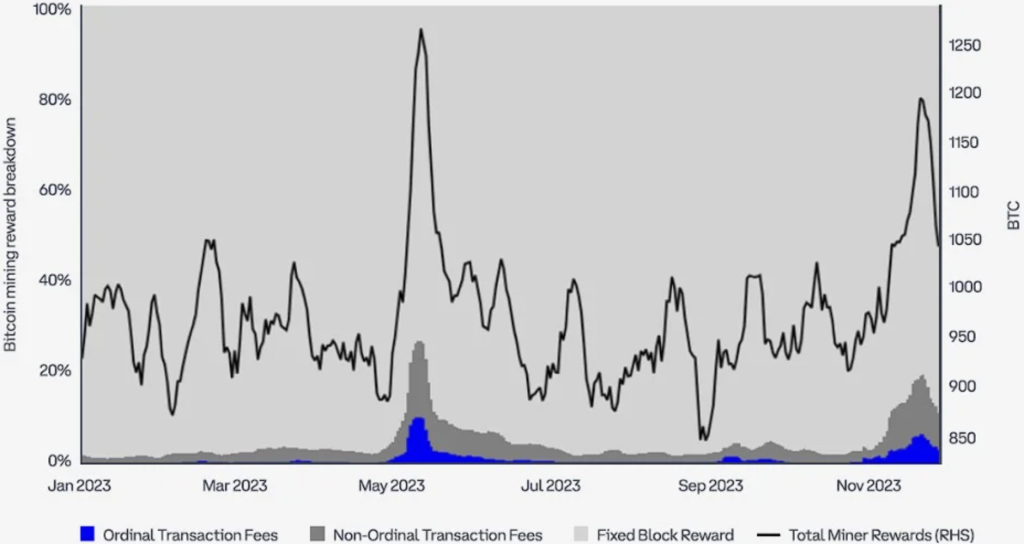
The explosive growth in fees paid from Ordinals has historically represented a significant share of block rewards—nearly 10% of all BTC paid to miners at its peak in May 2023. Increased activity Ordinals also has a cascading effect, stimulating overall demand for block space and increasing fees for everything other transactions - sometimes the total transaction fees rose above 20% of the total mining rewards.
Number of Ethereum transactions and rollups
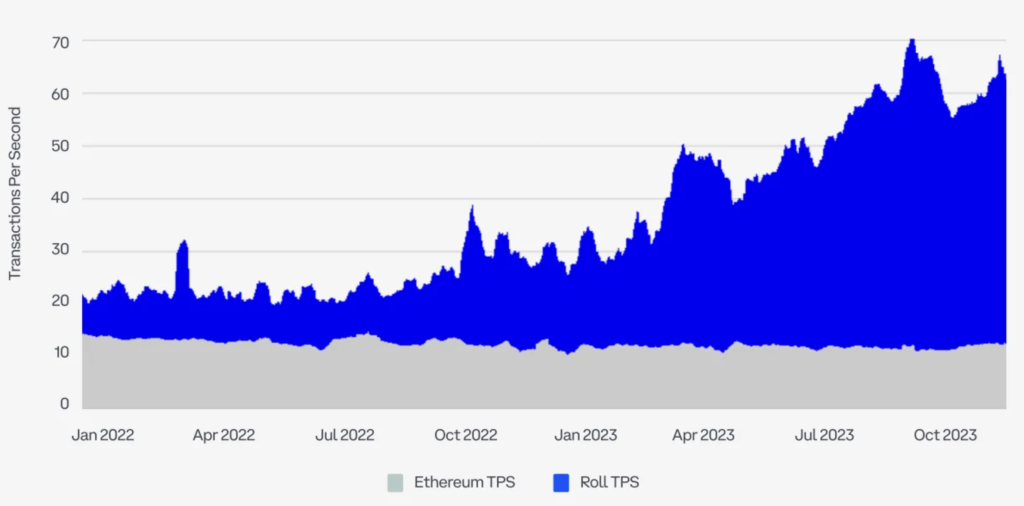 < p> TPS on rollups increased 3 times in a year, when on Ethereum the indicators remained the same.
 Number of NFT transactions for Ethereum and ordinals for Bitcoin
With the advent of ordinals on Bitcoin in May, a significant portion of NFT activity has shifted to them. During the drop in activity in Ordinals in early October, following rumors of their abandonment in favor of Runes, NFT activity on Ethereum recovered slightly. However, NFT activity on Ethereum fell again after the ordinals recovered in late October.
ETH staking by category
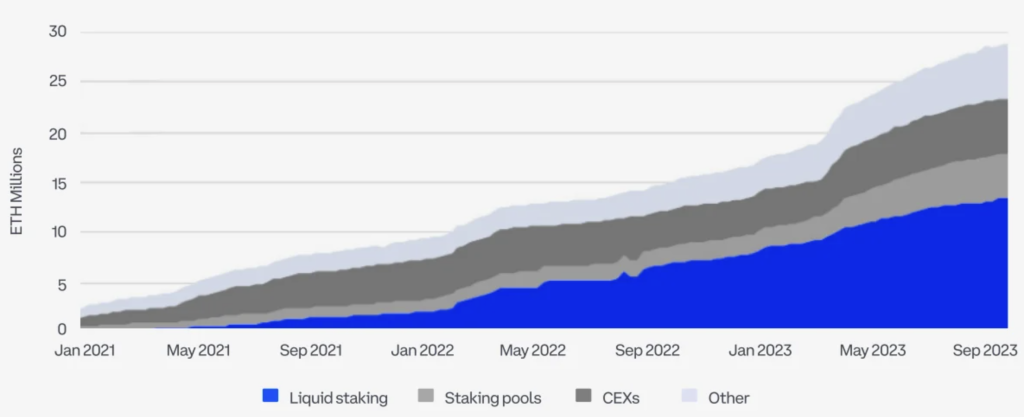
After the Shanghai update on Ethereum in April 2023, 28.2 million ETH were blocked as of November 2023, which is about 23.5% of the total supply of 120.3 million ETH, at the end of last year only 12.9% were blocked. Since the beginning of 2023, the share of liquid staking has increased to 47% of the total amount of ETH staked on Ethereum.
Number of blocked ETH in rollup bridges
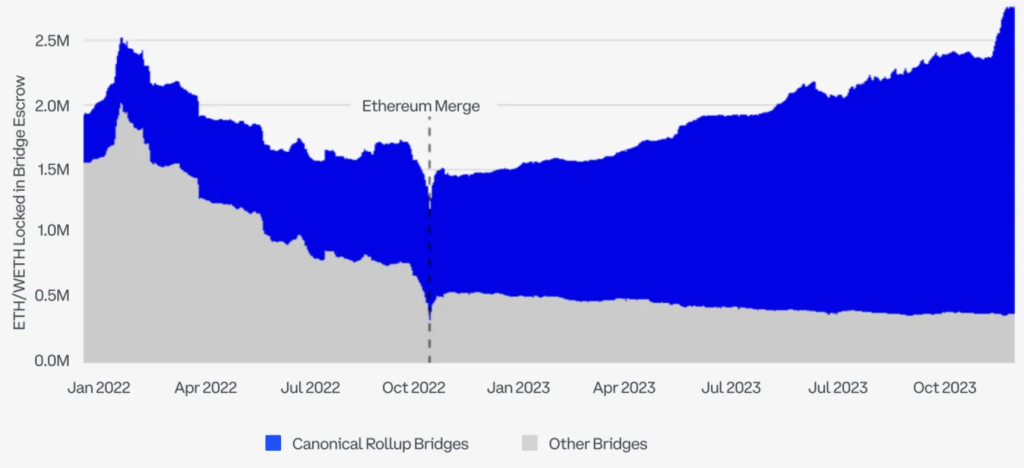 < p> After Ethereum Merge, canonical rollups (based on Ethereum) are gaining more and more blocked ETH in bridges. In 2022, canonical rollups had only 20% of ETH in bridges, but before the Ethereum update, the game began to turn upside down and currently this figure has grown to 80%.
 Canoncial Rollup Bridges include Arbitrum, Optimism, Base, zkSync Era, StarkNet< /a>, ImmutableX, Linea, Mantle, PolygonZk and < a target="_blank" href="https://back2crypto.com/projects/ico/scroll/">Scroll.
Other Bridges include Polynetwork, Multichain, Nomad, Harmony, Polygon PoS, Avalanche, Wormhole, Stargate, Omnibridge, Mantle, Rainbow Bridge, Gravity, Hop, Across, Connext, Symbiosis, Axelar, Ronin and Celer.
Number of blocked ETH in other rollups
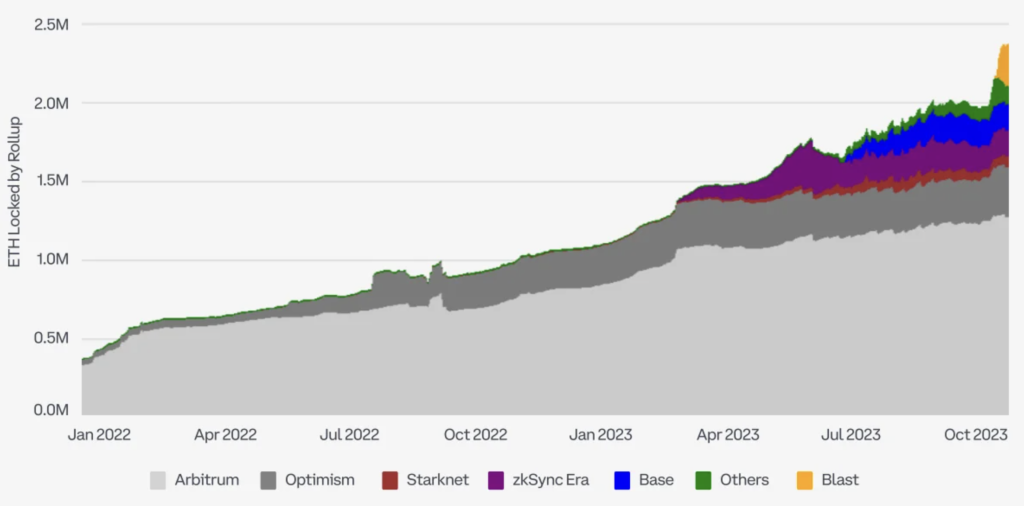 < p> ZK rollups have not yet been able to win a significant market share from optimistic rollups, since their transaction fees and TPS are not much lower than those of optimistic rollups. The rapid increase in the amount of ETH locked in the yet-to-be-released Blast reflects user interest in yield and could signal a new opportunity for the more than 2 million ETH locked in bridges to become better-performing assets.
 Change in TVL
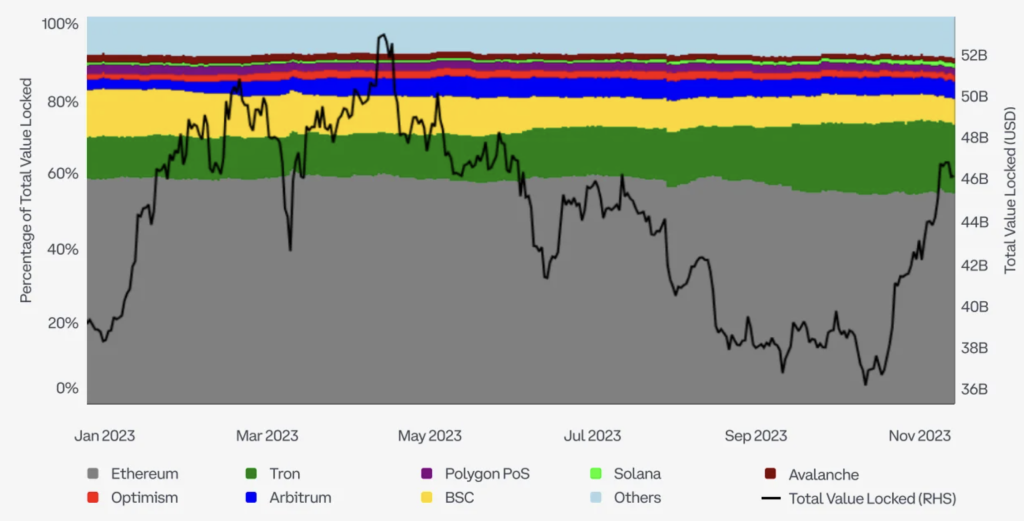
TVL Tron continues to rise gradually as BNB Smart Chain falls. The indicators of other blockchains remained on average in the same place.
Market capitalization of coins as a percentage of ETH
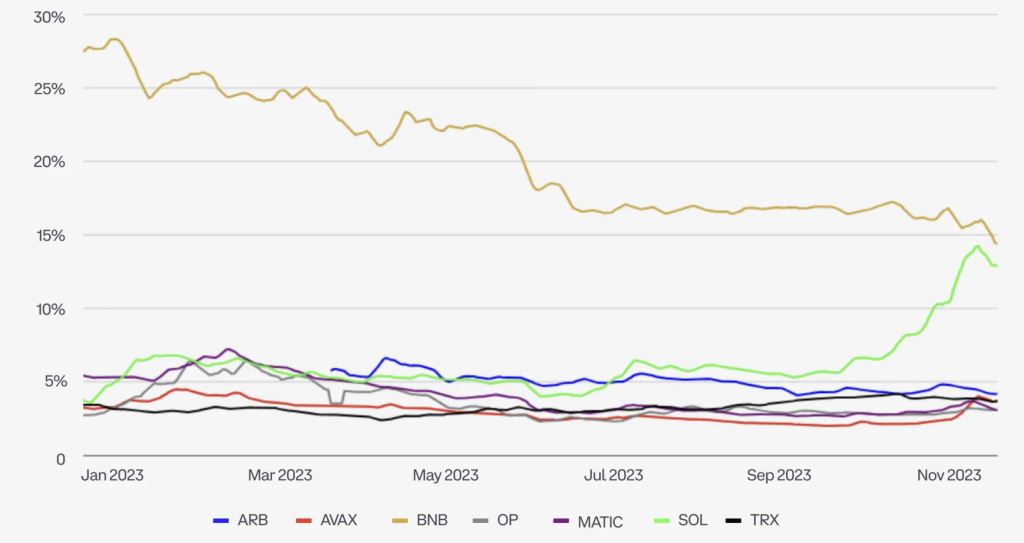
By the end of November 2023, the share of BNB in the ETH market capitalization decreased from 28% to 15%. At the same time, the share of SOL increased from 4% to 14% of ETH capitalization. SOL's growth largely occurred in the fourth quarter following the release of the v1.16 client from Solana Labs on September 23 and the announcement of Firedancer at the Breakpoint conference in early November.
It’s hardly noticeable on the chart, but AVAX also showed a significant increase to 2 .5% to 4% of ETH capitalization. MATIC, ARB, OP and TRX did not show significant results.
Correlation of stablecoin supply with trading volumes on Uniswap
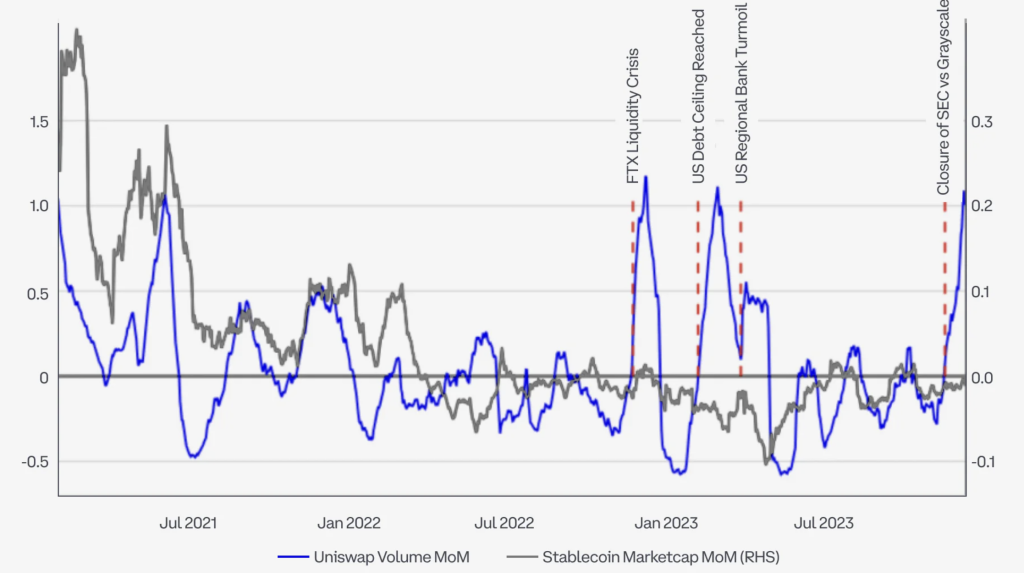
Changes in the supply of stablecoins on Ethereum correlate with changes in trading volume on Uniswap in the absence of significant external events, such as problems with FTX in November 2022, the US government debt limit reached in early 2023, the US banking crisis in March 2023 year and the satisfaction of Grayscale's claim against the SEC in August of this year.
There are currently about 127 billion stablecoins in circulation, which is 9% less than at the beginning of 2023 – 137 billion. At the same time, the total value of all cryptocurrencies has increased, as a result of which the share of stablecoins has decreased from 16% up to 8-9% of the crypto market share.
Changing the dominance of stablecoins
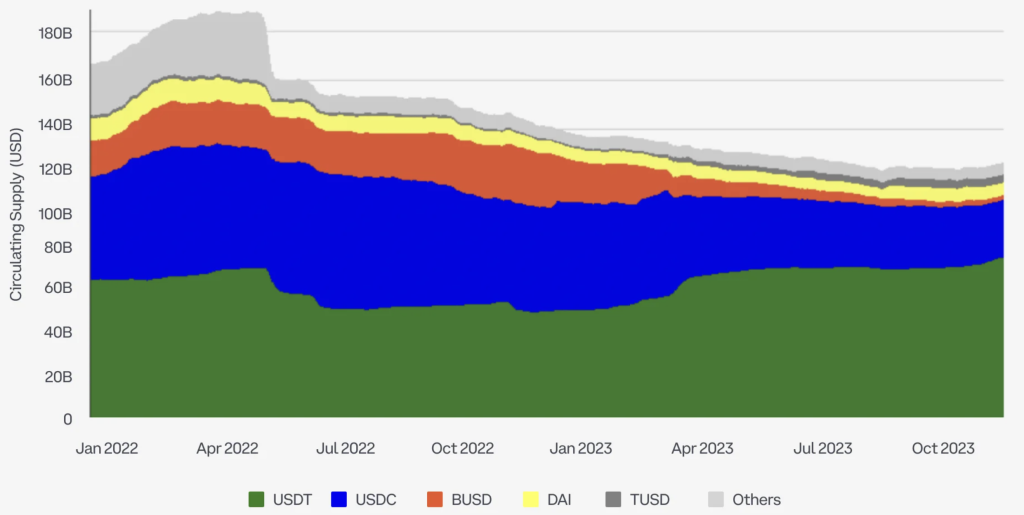
Share USDT in the total stablecoin supply has grown significantly. USDT's capitalization increased from $66 billion at the beginning of 2023 to more than $89 billion by the end of November, increasing its share of the stablecoin market from 49% to almost 70% currently. This increase is likely due to the shutdown of BUSD, whose market capitalization fell from $23 billion to less than $2 billion by the end of November. Also, the decline in USDC supply from $44 billion to $24 billion over the past year has likely contributed to the increase in USDT share.
Venture financing of blockchain and crypto projects
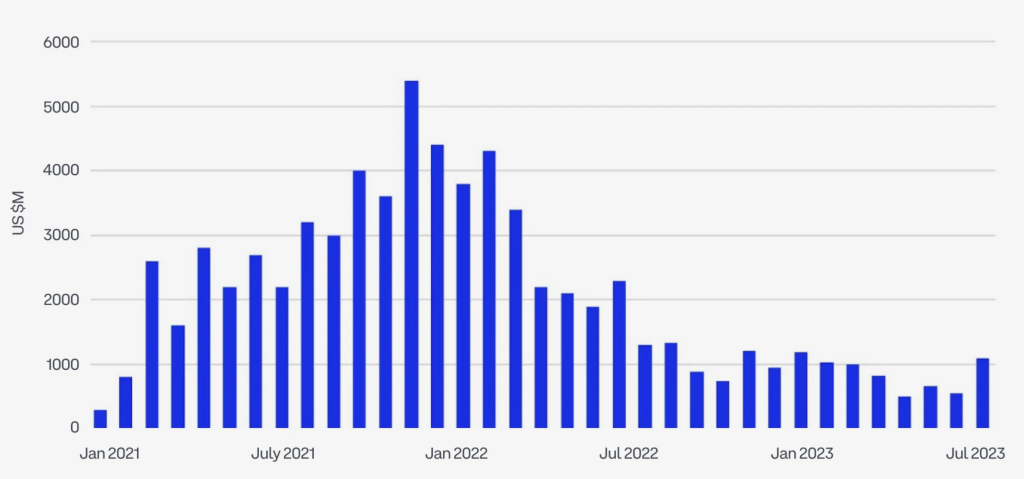 < p>The overall volume and value of deals in the venture capital landscape have slowed since the fourth quarter of 2021.
 Funding for crypto projects fell to $10.6 billion in the first 11 months of 2023, compared to $32.4 billion in the same period in 2022, even despite a significant increase in November this year.
The slowdown in capex also reflects reputational damage caused by the fallout from the collapse of FTX in late 2022 and associated regulatory uncertainty in the US.
Coinbase Ventures deals by sector for 2023/2022
Distribution of investments in 2023 by sector:
- Web3 protocols and infrastructure: 26% of all transactions (decrease compared to 2022);< /li>
- DeFi: 23% (slight increase from 2022);
- CeFi: 18% (significant increase from 2022);
- Consumer Solutions in the field of Web3: 17% (slight increase compared to 2022);
- Platforms and tools for developers: 17% (small increase compared to 2022).


